Vasishta Speaks
List of articles
 Forecasting your Admits – an Expert analysis
by Ramanujam Rengarajan, 18-Mar-2021- Assistance for Studying Abroad – Why required?
by Ramanujam Rengarajan, 26-Jan-2021 - COVID as a factor in your study abroad applications – Do you Know?
by Ramanujam Rengarajan, 18-Nov-2020 - Study Abroad – Options and Choices.
by Ramesh Sridhar - 17-Dec-2019
Forecasting your Admits – an Expert analysis

University of California, from the state of California, United States and a highly ranked institution received approximately 250,000 applications as per their most recent report. The acceptance rate average hovers at 30% with a low of 12% at LA. This means 80,000 students get admitted to UC over the year. The scene at the average ranked and the top ranked institutions is similar with varied level of acceptance rates.
To an ordinary observer the above figures mean nothing, it is but a figure and a competition for the institutions. Observing closely the student realises he is competing with both peers and the preference of the university.
Why do institutions accept/reject applications? Is there a pattern which students can observe to choose and shortlist better?
Let us explore and analyse!
Take Table 1, 1A below which consists of the profile of students.
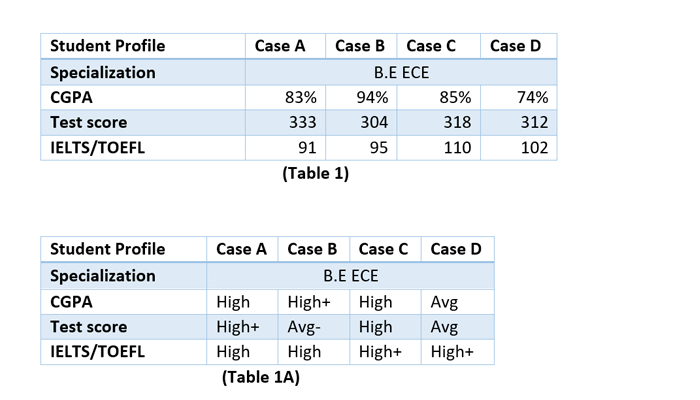
Therefore, the assessment is Case A and C are strong cases for Highly ranked institutions and Cases B and D are cases for average ranked institutions. Tables 2, 3,4 and 5 gives us the applied institutions list and the admits
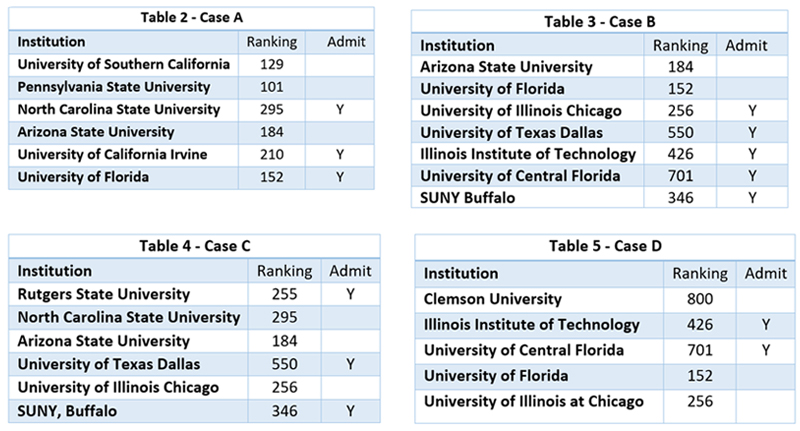
The tables consist of the institution, ranking and admit in that order. Y stands for an admit received and blank for a no admit. Now, let us take up the each of the shortlist.
- Case A opted for 4 highly ranked institutions (ranked between 100 and 200) and 2 average ranked (below 200) for a master’s in electrical engineering
- Case B opted for 5 average ranked institutions and 2 below average ranked institutions
- Case C and D opted for 1 highly ranked institution and 5 and 4 average ranked institutions respectively
A key point to note is that cases A, B and D opted for Electrical Engineering whereas C opted for Computer Science.
Moving further to the admit column gives us an idea about the applied vs admits scenario.
A cursory glance through Table 1 and 1A gives us an insight into the relative ranking of the profiles based on the scores. The profiles may be ranked in the order A, C, B and D. The reasons are:
- A has consistency compared to C and a high plus score i.e. 315 (GRE)
- B scores low in test score bringing down the options with highly ranked institutions
- D has a low academic score and an average test score while B has a high academic score
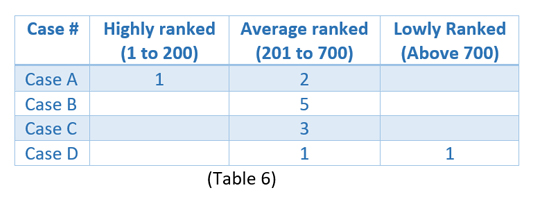
The admits table (Table 6) thus seems very logical going by the admits received.
- High Test score guarantees A 1 admit in the top 200 and rest in the range 200-300
- B and C receive similar admits and the reasons are not far to seek – They have one of the parameters ticked well (academic score or test score).
- D suffers due to an average score but is lucky to get one of the popular universities in the states
- A has an admit University of Florida which is higher ranked than Arizona state university
The above analysis proves that shortlisting as an element of application process is the difference between admission and rejection. A common element in the shortlisting were:
- 1) Institution mix
- 2) Ranking Band
To have a precise analysis of admit or reject you will require trends and inputs from experts or organisations dealing with higher education counseling. This was a student perspective of how to choose your shortlist well. How does an institution choose its student? Wait for an expert analysis by yours truly. Another day, another discussion!